

Abstract
Dense meteorological networks are needed to advance understanding of urban climatology in the northern polar region where global warming is rapid and amplified. High quality and density urban temperature datasets are required to monitor thawing processes in urban soils, properly assess and project climatic trends in human comfort, air quality and weather extremes. This study presents an Urban Heat Island Arctic Research Campaign (UHIARC) observational network, which has been deployed in several mid-sized cities (Salekhard, Vorkuta, Nadym, Novy Urengoy) of the Eurasian Arctic region in the winter of 2016–2017. The network comprises an array of air temperature loggers and one automatic weather station in each of these four cities. The UHIARC observations revealed strong warm temperature anomalies in all four cities. Such persistent temperature anomalies are frequently referred to as urban heat islands (UHIs). The mean wintertime magnitude of these temperature anomalies (the UHI intensity) was found to be between 0.8 K and 1.4 K. Extreme UHI intensities up to 7 K were observed during cold anticyclonic weather conditions. Such a strong mediation of cold temperature spells by UHI might induce considerable socio-economic and environmental impacts in the cities. The UHIARC dataset is available for further analysis from http://urbanreanalysis.ru/uhiarc.html.

Original content from this work may be used under the terms of the Creative Commons Attribution 3.0 licence.
Any further distribution of this work must maintain attribution to the author(s) and the title of the work, journal citation and DOI.
1. Introduction
The urban environment is complex and diverse. Local urban climate is forced by modified surface heat, moisture and momentum fluxes as well as by direct anthropogenic heating in cities. It can significantly deviate from regional climate observed by a sparse network of regular meteorological stations of the World Meteorological Organization, hereafter referred to as WMO stations. Urban climate features may in turn impact sustainability and the values of urban social, economic and cultural infrastructure. For instance, observed warmer temperatures have already weakened the bearing capacity of frozen soils in northern Eurasia in recent decades (Grebenets et al 2012, Shiklomanov et al 2017). A further advance of global warming will exacerbate these problems.
Widely expressed concerns about rising arctic temperatures have so far not resulted in high density urban temperature monitoring in northern polar cities. Dense urban networks, which comprise automatic weather stations (AWSs) and temperature loggers (TLs), cover an increasing number of low- and mid-latitude cities (e.g. Muller et al 2013). There are just three such networks in high latitude cities known to the authors. One network of more than 70 temperature sensors was deployed in Barrow, Alaska (Hinkel and Nelson 2007, Klene et al 2013). The other two dense networks were deployed by the authors in Norilsk (Varentsov et al 2014) and Apatity, Russia (Konstantinov et al 2015). These networks worked for shorter periods, continuously observing for just a few days. There were no such observations over the entire winter season in cities with cold continental climate at these high latitudes.
The present study narrows this critical data and knowledge gap. We present a new observational network that has been deployed in four cities of the Eurasian arctic region. The Urban Heat Island Arctic Research Campaign (UHIARC) network was deployed in the winter 2016–2017 in Vorkuta, Salekhard, Nadym, Novy Urengoy. Thus, the region of study comprises both the areas to the west and to the east of the Polar Urals Mountains in Russia. UHIARC includes arrays of five to 15 TLs and one AWS in each of these four cities.
The main UHIARC objective is to provide academics, engineers, stakeholders and city managers with reasonably accurate, spatially dense and interconnected information about urban temperature anomalies. UHIARC observations open an opportunity to monitor temperature variations and their synchronous patterns and impacts within and near the cities. Urban near-surface air temperature is generally warmer than the temperature of the natural background at high latitudes (Wienert and Kuttler 2005). The warm urban air temperature anomaly is frequently referred to as an urban heat island (UHI). Some studies, which resolve the urban planetary boundary layer, refer to it as to a canopy layer urban heat island (e.g. Oke 1976, Sun et al 2015, Smoliak et al 2015). The WMO weather station network is too sparse in these latitudes to capture the UHIs. The WMO stations are located outside, and often at large distance from the cities. There is typically just one WMO station (usually at the nearest airport) which can characterize the background climate conditions around each city in this region.
The paucity of the WMO network and a lack of interconnected urban temperature observations is partially compensated by land surface temperature (LST) products from satellites. An urban LST anomaly is widely referred to as a surface UHI (SUHI). UHIs and SUHIs are not always proportional to each other as they are forced by different combinations of drivers (Choi et al 2014, Sun et al 2015). Global SUHI surveys based on remote sensing data were presented by Peng et al (2012), Clinton and Gong (2013) and Zhou et al (2013). These works did not have their focus on the high latitudes, and therefore include only a few arctic cities (found above 63° N) in their analysis. A regional study of West Siberian cities was reported in Miles and Esau (2017). This study utilized the LST data product from the MODerate resolution Imaging Spectroradiometer (MODIS). It found intensive SUHIs in 28 Siberian cities. Another study (Esau and Miles 2016) reported that the SUHI in Nadym is collocated with the urban surfaces and infrastructure objects. Although the LST data are accessible at high spatial resolution (1 km for the MODIS LST data) and cover the region since 2000, they characterize only clear sky synoptic conditions. The SUHI is also sensitive to soil moisture and thermal properties of complex urban canopy. Seasonally averaged SUHIs are reasonably reliable indicators of the urban climate (Hu and Brunsell 2015, Gawuc and Struzewska 2016). The SUHIs averaged over shorter periods may produce less consistent patterns of urban temperature anomalies (Schwarz et al 2012, Sheng et al 2017). Statistical and physical relationships between the UHI and SUHI in high latitude cities remain poorly understood due to a lack of urban air temperature observations.
This brief introduction reveals that urban climate studies in high latitude cities are still underdeveloped. There are no reliable in situ data sets to characterize local climates in the largest arctic and sub-arctic cities. There are no relevant urban climatic temperature corrections to support infrastructure maintenance and new construction works. There are no data to relate the broader environmental, biodiversity and hydrological cycle changes with increasingly warmer local climates. Finally, there are no dense in situ observations to validate data products such as those obtained by remote sensing methods. This study presents a new data set, which is in demand for arctic urban studies and management. The data were collected in the winter of 2016–2017 in four cities. The next section presents the study area and the UHIARC network itself. The third section reports the results with emphasis on the UHI in those cities. The fourth section discusses the data and analysis in a broader context. The last section outlines the conclusions.
2. Data and methods
2.1. Study area
The region of study includes cities to the west and to the east of the Polar Urals Mountains in the Russian Federation. The UHIARC network was deployed in the four largest cities in the region, which are located near the northern polar circle. The cities are: Vorkuta, Salekhard, Nadym, and Novy Urengoy (figure 1). All these cities have grown from small settlements during rapid arctic industrialization in the Soviet era. The cities have similar urban planning and architectural solutions, which led to a similarity of urban surface morphology and urban climatic zones. By contrast to the sprawled low-rise neighborhoods of Scandinavian, Canadian and Alaskan cities, these four cities are densely built with mid-rise apartment blocks with centralized heating. The prevailing local climate zone (LCZ) in all cities is the open mid-rise zone LCZ5 (Stewart and Oke 2012). The heavy industry zone LCZ10 and the large low-rise (LCZ8) are also found in the cities. The open low-rise (LCZ6) zone is found only in Salekhard. This similarity is greatly facilitating intercomparison studies for these cities. The city populations, areas and regional climatic parameters are given in table 1.

Figure 1. (a) Location of UHIARC sites and other urban areas in northern Eurasia. Settlements with the population larger than 1000 inhabitants (the MaxMind urban database from www.maxmind.com) are shown by blue circles, the areas of which are proportional to the population. The yellow circles show cities for which the UHI studies were published: Oulu (Hara and Autio 2006, Zhou et al 2013); Murmansk (Konstantinov et al 2014, Demin et al 2017); Norilsk (Varentsov et al 2014); and Apatity (Konstantinov et al 2015, Demin et al 2016, Varentsov et al 2017). The red circles identify the four cities in this study. (b) The region within the red dotted rectangle on the panel (a). Yellow crosses indicate the WMO stations (www.rp5.ru). The black dashed line shows the Polar Circle.
Download figure:
Standard image High-resolution imageTable 1. Information about the cities and periods of observations of the UHIARC network.
| Information about rural WMO weather stations | Details of UHIARC observations | |||||
|---|---|---|---|---|---|---|
| City (population and areaa) | Location and elevation range within the built areab | Location, elevationd and WMO ID | Mean DJF temperature and wind speedb | Number of TLs | Observational periods | |
| AWS | TLs | |||||
| Vorkuta (58 000, 9 km2) | 67.498°N, 64.063°E 130–180 m | 67.492°N, 63.975°E, 165 m, ID 23226 | –18.1 °C, 5.1 m s−1 | 7 | 31.01.2017 – 15.03.2017 | 31.01.2017–03.07.2017 |
| Salekhard (48 500, 7 km2) | 66.532°N, 66.628°E, 10–30 m | 66.532°N, 66.675°E, 15 m, ID 23330 | –21.8 °C, 2.3 m s−1 | 7 | 02.02.2017 – now | 02.02.2017–11.05.2017 |
| Nadym (44 600, 6 km2) | 65.534°N, 72.527°E, 7–8 m | 65.48°N, 72.689°E 14 m, ID 23445, | –21.5 °C, 3.3 m s−1 | 15 | 14.12.2016 – now | 14.12.2016–10.05.2017 |
| Novy Urengoy (114 000, 12 km2) | 66.083°N, 76.668°E, 35–65 m | 66.074°N, 76.5°E, 58 m, ID 23358 | –23.4 °C, 4.1 m s−1 | 5 | – | 13.12.2016–09.05.2017 |
| Apatityc (59 000, 5 km2) | 67.566°N, 33.402°E 140–200 m | 67.551°N, 33.362°E, 132 m, ID 22213 | –11 °C, 2.5 m s−1 | 4 | 10.12.2015–now | 10.12.2015–01.03.2016 |
aAn approximate area of densely build urban core is considered, excluding separated residential and industrial districts. bCalculated for 2005–2017 according to the data from the websites www.rp5.ru and www.meteo.ru. cDetails are not considered in this study, see Varentsov et al (2017). dThe city elevation above the sea level.
The regional climate of this area is of a Dfc type (a cold and humid climate) according to the Köppen-Geiger climate classification. The severity of the climate is increasing eastward, mainly due to a decrease in winter temperatures. The cities are located in the northern taiga (boreal forest) and tundra-forest bioclimatic zones.
Vorkuta is the most western city in this study. It is found in the Komi administrative region on the western slopes of the Urals, which makes its hilly relief different from the nearly flat surfaces of the other cities. Salekhard is a capital of the Yamal-Nenets administrative region (YNAO) on the eastern bank of the Ob-Poluy river. Nadym and Novy Urengoy are found further east in the YNAO amid oil and gas fields. The nearly flat surface of the three YNAO cities makes them a convenient choice for the UHI studies. Apatity in Murmansk region is the fifth city with continuous UHIARC observations. Results for Apatity are not analyzed in detail in this study, but are briefly introduced in the Discussion section, while more details can be found in (Varentsov et al 2017).
The urban climate studies require synchronous observations from at least a pair of stations, which are located within and outside of each city (Mishra et al 2015). There are no cities in our region (figure 1(b)), and perhaps in the whole Arctic, which have such a pair of urban and background WMO weather stations. The existing nearby stations are primarily located at airports or in remote suburbs.
2.2. The UHIARC network
We installed the UHIARC network in four studied cities in the winter 2016–2017 (figure 2). In Vorkuta, Salekhard and Nadym, the network consists of one AWS Davis Vantage Pro2 and the TLs iButton from Maxim Integrated Inc. The network in Novy Urengoy did not possess an AWS. According to the urban network classification by Muller et al (2013), the UHIARC is a city-scale network.

Figure 2. The UHIARC networks in four studied cities: (a) Vorkuta; (b) Salekhard; (c) Nadym; (d) Novy Urengoy. The urban AWSs and the background (rural) WMO stations are shown by yellow circles. The iButton TLs are shown by red squares. TLs are identified by capital letters (V, S, N and U) and numbers. Satellite images from Google Maps® are used as the background. Surface elevation (green contours with numbers on white background) are given according to the ASTER Digital Elevation Model, which has been smoothed by the running average over 300 m × 300 m grid cells. In Vorkuta, isohypses below 140 m (in the river valley) are not shown. The elevation of the observation sites is taken from the Google Earth® Digital Elevation Model or from the WMO station meta-data. Surface elevation of all Nadym sites does not exceed 8 m.
Download figure:
Standard image High-resolution imageDavis Vantage Pro2 is a popular, inexpensive and stable meteorological station with measurement accuracy of 0.5 K (Bell et al 2015). The AWSs were installed within the urban area with the temperature sensors at 2 m above the ground. Measurement frequency varied from 1 minute to 1 hour.
The iButton TLs are also popular for the spatially resolved urban climate studies (Malevich and Klink 2011, Ojeh et al 2016), but they require careful radiation shielding. The TL accuracy is 0.5 K. The direct solar radiation is not a problem for our study since the sun was mostly under the horizon during the winter months. Each TL was covered with a rubber membrane and attached to a tree branch at about 2 m height above ground (figure S1.1 available at stacks.iop.org/ERL/13/075007/mmedia). The measurement frequency was 1 hour. The TL observations were run over a shorter period of time than those with AWSs as they have to be collected and processed manually after the measurement season (table 1). We run an intercomparison study for three TL sensors (N15, N2 and V7) and the closest AWSs or WMO stations. This study confirmed that the TL data are unbiased and unaffected by solar radiation for the solar angles less than 5° (supplementary S2).
To complement the network with background site observations, we used data from the nearest WMO stations in each city. The measurement frequency of those stations was 3 hours. They are located in proximity to the airports (except that in Salekhard) at approximately the same elevation above the sea level as the city themselves (see details supplementary table S1.1).
2.3. The collected data sets
The available data sets include the air temperature and weather reports collected during the winter of 2016–2017. In this study, we process data covering three time periods (figure 3). These periods were chosen to maximize the continuous data coverage and to meet the low solar height conditions. The first period, P1, covers a period since the beginning of observations in Nadym and Novy Urengoy (December 14th 2016) until the beginning of observations in Vorkuta and Salekhard (February 2nd 2017). The solar height during the most of the P1 period is lower than 5°. It allows the use of TL observations 24 hours a day. The P2 period covers the dates from February 2nd to March 15th of 2017. The P2 data are available for all four cities, which makes it convenient for the UHI intercomparison. The additional P0 period covers dates from December 14th 2016 to March 1st 2017. The P0 data characterize a typical December, January and February (DJF) winter season, which is frequently used in other climatological studies.

Figure 3. Periodization (P0, P1 and P2) of the collected UHIARC data. The daily maximum solar height in four cities is shown by the color lines. The capital letters show the data availability for different cities.
Download figure:
Standard image High-resolution imageThe AWS data have significant gaps during the coldest weather conditions. The data from Nadym and Novy Urengoy are partially absent between 17th and 23rd of December and 2nd and 5th of January as the AWS (TL) measurements have the lower limit of −41 °C (−39.3 °C). The effect of the missing data on the present study is discussed in the supplementary material S2.
2.4. Calculation of the UHI intensity and a weather factor
Let us introduce temperature, T, and temperature difference, ΔTji, for a pair of sensors i and j,

Here, the temperature can be provided from any of the TL sensors, the urban AWS and the background WMO stations in each city. The UHI intensity is defined as the difference between the urban AWS and the background WMO station, i.e. ΔTWMOAWS = TAWS−TWMO.
The characteristics of an observed UHI are sensitive to the UHI definition and mutual configuration of the observing stations (Stewart 2011, Mishra et al 2015). Therefore, it is worth considering alternative definitions of the UHI intensity. We introduce three alternative definitions in this study. The first alternative is based on the temperature difference between urban AWS and the spatially-averaged temperature of a selection of representative rural TLs (located at a similar altitude to urban ones), ,


The representative rural TLs are identified as V1, V2 in Vorkuta, S1 in Salekhard, N1 to N5 in Nadym and U1, U2 in Novy Urengoy.
The other two alternative definitions utilize the warmest (on average) TL in the city as a source of the urban temperatures, TwTL, instead of the temperature from the urban AWS:


The warmest TLs in the cities were correspondingly V7 in Vorkuta, S6 in Salekhard, N11 in Nadym and U4 in Novy Urengoy. The alternative UHI intensities were calculated only for the hours with the solar height of less than 5°. This eliminated possible biases due to direct solar heating of the TL sensors.
It is known that UHI intensity could be particularly large under clear sky and calm weather conditions, which are typical in anti-cyclonic weather. A number of empirical regressions or physically-based scaling factors were developed to account for relationships between the UHI intensity and meteorological characteristics (e.g. Oke 1998, Lee et al 2014, Theeuwes et al 2017). These regressions are actively used in studies of mid-latitude cities, but their utility for high-latitude studies is limited. The polar night or very low solar height in winter make the solar scaling factors irrelevant to the arctic UHI studies. Moreover, only the basic meteorological observations were available from the considered WMO stations. Therefore, we use only a so-called weather factor Wf, introduced by Oke (1998) and defined in our study as:

where u is the wind speed and nt and nl are the total and low-level cloud fractions. The weather factor is calculated using the observations at the WMO stations.
3. Results
3.1. Intensity and variability of UHIs
The UHIARC network reveals the UHIs of large intensity in all four arctic cities (table 2). The mean winter UHI intensity (ΔTWMOAWS is about 1 K in all cities. The extreme values for the 99th percentile are between 5.9 K and 6.7 K, whereas the values for the 95th percentile are between 3.8 K and 4.4 K. There is good agreement between the standard (after equation 1) and the alternative (after equations 2–4) estimates of UHI intensity.
UHI intensity is very sensitive to the weather factor Wf (figure 4). The correlation coefficients between the daily-average values of Wf and the UHI intensity are 0.77 for Nadym and 0.68 for Novy Urengoy. The larger UHI intensities (up to 7 K) were observed mostly for Wf > 0.6. The Wf increase results in a sharp temperature drop. The urban temperature decreases more slowly so that the difference between the WMO and the AWS data increases. Thus, the UHI is shaped not by a persistent temperature difference between the urban and the background areas, but by a damped response of the urban temperatures on the atmospheric cooling. The data for the shorter P2 period confirm the dependence between the UHI and Wf for all four cities (figure S3). UHI intensity is correlated between the cities due to the correlated regional-scale weather variations.

Figure 4. (Upper panels) Observations of the air temperature in the city center by the urban AWS in Nadym (a) and the warmest urban TL in Novy Urengoy (b) (the red line) and by the natural background WMO stations (the black line) during the P1 period. The UHI intensity (ΔTWMOAWS and ΔTWMOwTL is shown by orange shading. (Lower panels) Variations of the weather factor, Wf, (blue line) and the solar height over the horizon (the orange line and shading). The light blue shading indicates anti-cyclonic weather periods with Wf > 0.6.
Download figure:
Standard image High-resolution imageThe temperature variability at high latitudes lacks the diurnal cycle in wintertime. Hence, arctic UHIs are not expected to show a typical diurnal cycle with the daily minimum and the nocturnal maximum, known for mid-latitude cities (Oke 1982). There are almost no diurnal cycles in the UHI intensity in Nadym and Novy Urengoy during the P1 period (figure 5). The late winter P2 period shows larger diurnal cycles both in the UHI intensity and the rural temperatures itself in Nadym and Salekhard, but not in the most northern city of Vorkuta (figure 5).
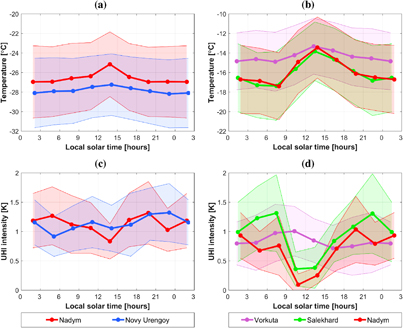
Figure 5. The average diurnal cycles of the air temperature at the background WMO stations (a, b) and the averaged diurnal cycles of the UHI intensity (c) and (d), defined as ΔTWMOAWS or ΔTWMOwTL for Novy Urengoy. The data are given for the periods P1 (a) and (c) and P2 (b) and (d). Color shading indicates the respective confidence intervals (p = 0.05).
Download figure:
Standard image High-resolution image3.2. Spatial temperature distribution in and around the cities
The UHIARC data reveal that UHIs cover the entire urban areas as in the field of mean winter temperature (figure 6) as for selections of extreme UHI cases (figure S4). Nadym is the most compact and flat city with the densest sensor network among the other three UHIARC cities. Figure 6 shows that UHI intensity decreases from the geographical city center, where it is 1.3 K (5.7 K for the selection of extreme UHI cases) towards its limits.

Figure 6. The geographical distribution of the averaged air temperature anomalies (colors) in the urban areas of Vorkuta (a), Salekhard (b), Nadym (c) and Novy Urengoy (d). The anomalies, ΔTWMOi, are calculated as the differences between the station i and the background WMO staion in each city. The anomalies were averaged over the P1 (c) and (d) and P2 (a) and (b) periods. Averaging was applied only for the hours with the solar height less than 5°. The AWS and WMO stations are shown by circles, the TLs—by squares.
Download figure:
Standard image High-resolution image
Figure 7. The UHI intensity in all four arctic cities separated in 10 °C temperature intervals. The box plots show the period P0 (a) and P2 (b). The UHI is defined as ΔTWMOAWS in Nadym, Vorkuta and Salekhard and as ΔTWMOwTL in Novy Uregnoy. The horizontal colored lines show the mean UHI intensities over considered periods.
Download figure:
Standard image High-resolution image
Temperature anomalies could be also found around the cities. The landscapes in Vorkuta and Salekhard are more complex due to hills and rivers. The lower places could be affected by cold air drainage, while the higher places show warm anomalies, as e.g. S2, S3 and V3, V4 sites. Several authors have pointed out on a significant effect of site elevation and ventilation regimes in the formation of local temperature anomalies (Kirby and Sellers 1987, Kuttler et al 1996, Daly et al 2009, Demin et al 2016). Although we cannot completely exclude the influence of such effects, the UHIARC data revealed that the urban sites are always warmer than any of the rural sites.
4. Discussion
Urban climates of the high-latitude cities are still poorly understood. There are very few in situ studies based on sufficiently dense observational data. In the winter of 2016–2017, we deployed the UHIARC meteorological network to study urban temperature anomalies in four arctic mid-size cities. Analysis of the UHIARC data revealed rather strong and persistent UHI. The UHI intensities were rather similar in all four cities. Moreover, the UHI intensities, obtained with four alternative definitions after equations 1–4, were also similar and constituted about 1 K for mean values and about 5–7 K for extremes (table 2).
Table 2. Mean value of the UHI intensity (ΔTmean) and its 95% and 99% percentiles (ΔTp95, ΔTp99), calculated after equations (1)–(4) for the periods P0 and P2.
| Statistics and periods of their calculation | ||||||||
|---|---|---|---|---|---|---|---|---|
| City | UHI intensity definition | P0 | P2 | |||||
| ΔTmean | ΔTp95 | ΔTp99 | ΔTmean | ΔTp95 | ΔTp99 | |||
| ΔTWMOAWS | All cases | 1.0 | 4.2 | 5.9 | 0.7 | 3.4 | 5.5 | |
| Nadym | Cases with solar height < 5 °) | 1.1 | 4.3 | 6.0 | 0.8 | 3.9 | 5.9 | |
| ΔTrTLAWS | 0.9 | 4.0 | 6.1 | 0.8 | 3.2 | 6.3 | ||
| ΔTWMOwTL | 1.3 | 5.0 | 6.4 | 1.2 | 4.5 | 7.3 | ||
| ΔTrTLwTL | 1.2 | 4.5 | 6.4 | 1.1 | 4.3 | 7.0 | ||
| Novy Urengoy | ΔTWMOwTL | Cases with solar height < 5 °) | 1.1 | 3.8 | 5.7 | 1.1 | 3.6 | 4.7 |
| ΔTrTLwTL | 1.0 | 3.5 | 4.9 | 0.9 | 3.4 | 4.8 | ||
| ΔTWMOAWS | All cases | – | – | – | 0.8 | 3.9 | 6.7 | |
| Vorkuta | Cases with solar height < 5 °) | – | – | – | 0.8 | 3.7 | 6.7 | |
| ΔTrTLAWS | – | – | – | 1.3 | 6.3 | 7.7 | ||
| ΔTWMOwTL | – | – | – | 0.6 | 3.0 | 5.7 | ||
| ΔTrTLwTL | – | – | – | 1.1 | 5.3 | 6.9 | ||
| ΔTWMO st.AWS | All cases | – | – | – | 0.9 | 4.4 | 6.6 | |
| Salekhard | Cases with solar height < 5 °) | – | – | – | 1.2 | 5.0 | 6.7 | |
| ΔTrTLAWS | – | – | – | 1.1 | 3.9 | 4.9 | ||
| ΔTWMOwTL | – | – | – | 1.4 | 7.6 | 9.4 | ||
| ΔTrTLwTL | – | – | – | 1.4 | 5.1 | 7.4 | ||
There are almost no reports to compare our analysis with. Previous studies in Apatity (Konstantinov et al 2015, Demin et al 2016) found extremely large winter UHI intensity in that city. The urban-rural temperature differences were on average 2 K and reached extremes of up to 10–12 K. More detailed analysis revealed that such extreme values were partially caused by local orographic effects. Apatity is located at the top of a hill of 40 m height, while the rural WMO station has lower elevation and could be affected by cold air drainage under stably-stratified atmospheric conditions The anthropogenic heat flux contributed about 50% or about 1 K to the observed mean urban-rural temperature difference (Varentsov et al 2017), which is similar to the UHI intensities in this study. The wintertime UHI intensity of 1 K was found in many cities worldwide, e.g. in subarctic city Fairbanks, Alaska (Magee et al 1999) and in mid-latitude cities London (Wilby 2003), Belgrade (Unkašević et al 2001) and Szeged (Unger 1999). Similar values of 95th and 99th percentiles were found in Barcelona (Moreno-Garcia 1994) and in Dutch cities (Steeneveld et al 2011).
Pronounced wintertime UHIs in arctic cities are surprising in the context of the assessed literature. Indeed, early hypotheses attributed the UHI to solar heat trapping and redistribution within the diurnal cycle so that the maximum UHI should be observed during summertime nights (Oke 1982). Later, it has become obvious that the UHI is a less subtle phenomenon with warm urban anomalies observed around the day (e.g. Oke 2006, Steeneveld et al 2011). Radiation trapping by urban canopy and reduced evapotranspiration have been considered as the main drivers of the UHI (Christen and Vogt 2004, Ryu and Baik 2012).
The UHI is still mainly considered as a summertime phenomenon. The wintertime UHI in low- and mid-latitude cities are much smaller as many studies show (e.g. Choi et al 2014, Zhou et al 2015). At the same time, early, perhaps over-simplified energy balance models suggested physical mechanisms, such as atmospheric static stability and surface emissivity contrasts (Jin and Liang 2006), which could significantly amplify the UHI in high latitudes. It has been realized that direct anthropogenic urban heating could significantly contribute to warmer urban temperatures (Sailor and Lu 2004). Urban heating is particularly intense in dense arctic cities where the mean winter difference between the street and room temperatures exceeds 40 K. Anthropogenic heating is applied in the studied region for 250–290 days a year. As direct solar radiation is almost absent through the winter months, the surface radiation budget is negative and evaporation is negligible due to very low temperatures, it is likely that anthropogenic heating is the primary driver of the UHI in cold climates.
The released anthropogenic heat is trapped in a very shallow surface layer where the atmospheric stability impedes the vertical mixing. In the stably stratified atmosphere, even relatively modest heat fluxes can significantly raise temperatures as they warm only a limited amount of air (Esau et al 2012, Davy and Esau 2014, 2016). This mechanism gives an amplifying factor to the UHI in mid-sized arctic cities. Figure 7 confirms that UHI intensity increases in colder conditions.
5. Conclusion
The UHIARC network was deployed in four cities with a cold continental climate. This network collected synchronous in situ temperature data during the winter of 2016–2017. This unique data set has a dense spatial coverage, which makes it suitable for the tasks of urban planning and management as well as for the validation of remote sensing studies and high-resolution meteorological models.
The UHIARC data revealed rather strong and persistent UHI in the arctic cities. The mean winter UHI intensity ranges from 0.8 K to 1.4 K. Its 95th percentile ranges from 4 K to 5 K; while its 99th percentile exceeds 7 K. The most pronounced UHIs were observed during calm and clear anticyclonic weather, which usually corresponds to low observed temperatures.
Such a strong UHI in cold climate likely induces considerable economic and environmental impacts. The infrastructure and green spaces of arctic cities are sensitive to soil temperatures. The warmer soils thaw and dry more quickly changing the ground bearing capacity and the hydrological cycle. At the same time, the warmer temperatures alleviate working requirements and enhance urban vegetation. Positive social impacts of the UHI could be expected for the arctic cities due to the possible mitigation of harsh frost conditions and decreasing wintertime fuel consumption (Davies et al 2008, Kolokotroni et al 2009).
The freely available UHIARC dataset
Since the UHIARC network is designed to obtain and distribute unique data about the UHI intensity in large cities in the Arctic, the dataset is available on the server http://urbanreanalysis.ru/uhiarc.html (see supplementary S5 for details).
Acknowledgments
The development of the UHIARC network was partially supported by the Belmont Forum project HIARC: Anthropogenic Heat Islands in the Arctic: Windows to the Future of the Regional Climates, Ecosystems, and Societies (no. 247468), Russian Foundation for Basic Researches, projects No 15-55-77004, No 17-05-01221 and 18-05-00715.
The deployment of UHIARC network in Vorkuta and Salekhard was supported by the crowdfunding project 'Arctic Odyssey-2017' with particular contributions from: Boris Zhilin (Switzerland), Vladimir Platonov (Russia), Alexander Gerasimov (Russia), and Elizaveta Androsova (Russia). Assistance and hosting of the AWS were supported by: the Nadym Museum 'Dom Prirody' (Dmitry Bezugly); the Vorkuta Mining College (Viktor Tel'nov); the YNAO department for science and innovation (Alexey Titovsky); the YNAO Arctic Research Center (Anton Sinitsky). We also express particular gratitude to Alexander Baklanov (WMO), Vladimir Masloboev, (Kola Science Center of Russian Academy of Sciences), Irina Repina (IAP RAS) and all participants of the expedition 'Arctic Odyssey-2017': Alexander Varentsov, Olga Gommerstadt, Ekaterina Marchuk, Anastasia Semenova, Alexander Osipov, Larissa Sokolova and Sergey Shuvalov.